BIT TREASURE: Insight into the impact of CPI on cryptocurrencies such as Bitcoin and Ethereum, becoming a necessary path for trading experts
With the continuous development of blockchain and cryptocurrency technology, the size of the cryptocurrency market is getting larger and larger. Initially, only a few geeks were trading. Now, more and more investment institutions, private enterprises, listed companies, etc. are continuing to enter, and some countries even use Bitcoin as their legal tender.

This development trend has made the connection between the cryptocurrency market and traditional financial markets increasingly close, and has prompted some Wall Street institutions to launch a series of compliant products targeting Bitcoin, such as futures Bitcoin ETFs, Bitcoin Trust Funds (GBTC), etc.
At the same time, cryptocurrencies, like other risky assets, are increasingly affected by macroeconomic factors. Even the release of a macroeconomic data indicator may trigger drastic fluctuations in cryptocurrency prices.
Therefore, macroeconomic analysis is an indispensable part of analyzing the direction of the cryptocurrency market.
Some important macroeconomic indicators, such as the Federal Reserve's interest rate resolution GDP Non agricultural employment data CPI and other macroeconomic indicators may have a significant impact on the price of cryptocurrencies, and in these macroeconomic indicators, CPI is particularly noteworthy.
Actually, CPI data is not only the focus of global investors, but also one of the key indicators that the Federal Reserve refers to when formulating monetary policy.
So, what exactly is CPI? How does it affect the cryptocurrency market? What is the logic behind it?
Bit Treasury will lead everyone to understand CPI indicators to enhance your macroeconomic data analysis skills and help you make wiser decisions in cryptocurrency investments.
1、 Consumer Price Index (CPI)
The Consumer Price Index (CPI) is a measure of the impact of price changes in a basket of goods and services on consumer purchasing power.
Due to the fact that the United States is the world's largest economy and the existence of "US dollar hegemony", the US dollar is closely related to the world economy. Therefore, the monetary policy of the Federal Reserve has a huge impact on the global economy and investment markets. So, we will focus on discussing the CPI data of the United States, and the CPI mentioned in the following content specifically refers to the US CPI.
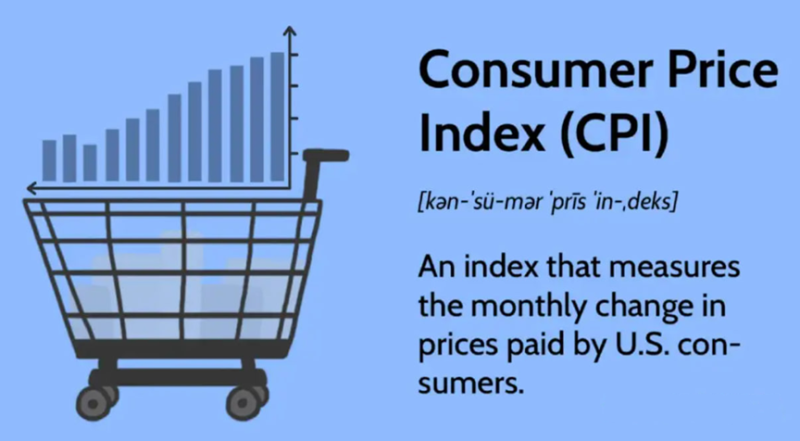
CPI is a regularly released indicator by the US Bureau of Labor Statistics, used to measure the price changes of a basket of typical consumer goods and services, in order to reflect the level of inflation.
The CPI data is released in the middle of each month and is one of the most important reference indicators for the Federal Reserve when formulating monetary policy.
II How CPI is calculated
We can have a rough understanding of the calculation process of CPI.
CPI measures the total cost of goods and services purchased by ordinary consumers. However, in daily life, consumers purchase a wide variety of goods or services, and the consumption habits of different families and individuals are also different.
Faced with a vast array of goods and services, It is obviously not feasible and unnecessary to calculate the total cost of CPI, so we will choose the goods and services that are most important to ordinary consumers as representatives.
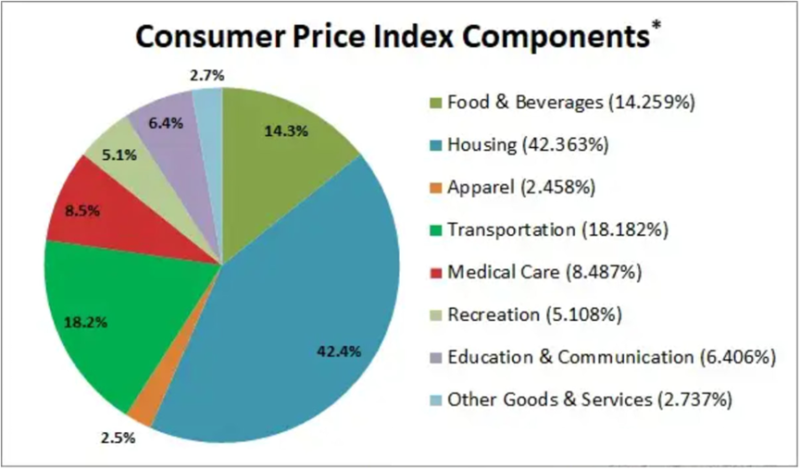
in the U.S. The CPI index mainly tracks over 200 commodity categories, covering 8 major categories:
1) Food and beverages (breakfast cereal, milk, coffee, etc.);
2) Housing (main residential rent, owner's equivalent rent, etc.);
3) Clothing (men's shirts and sweaters, women's dresses, jewelry, etc.);
4) Transportation (new cars, air tickets, gasoline, motor vehicle insurance, etc.);
5) Healthcare (prescription drugs and medical supplies, doctor services, glasses and eye care, hospital services);
6) Entertainment (cable TV, pets and pet products, sports equipment, etc.);
7) Education and communication (university tuition fees, postage, telephone services, etc.);
8) Other goods and services (tobacco and smoking products, haircuts, and other personal services).
Of course, the goods or services included in the statistics do not include investment projects such as stocks, bonds, real estate, and life insurance, as these projects are related to savings and not to daily consumption expenditures.
Then, The CPI data statistics department will assign different weights to different categories of goods, which are determined based on the proportion of consumers purchasing these goods or services. The higher the proportion of consumption, the higher the weight in CPI.
Of course, the weight of these goods or services in the CPI calculation process is not fixed, but will be adjusted according to consumer purchasing habits.
After determining the category and weight of goods or services, the statistics department will send people to survey outlets to collect prices, and will also collect original prices from the Internet, such as collecting prices in different cities and supermarkets across the country, and collecting prices on Internet e-commerce platforms.
Collect and summarize these data, and then calculate CPI.
Of course, for the specific CPI calculation process, you can refer to the website of the US Department of Labor. As investors, we don't need to delve into it, just understand the general calculation process.
In fact, from the calculation process of CPI above, it can be inferred that, CPI is nothing more than selecting typical goods or services, assigning them different weights, and continuously counting and tracking their price changes to reflect changes in the US price level.
If the inflation rate is positive, it indicates an increase in the price level; if the inflation rate is negative, it indicates a decrease in the price level.
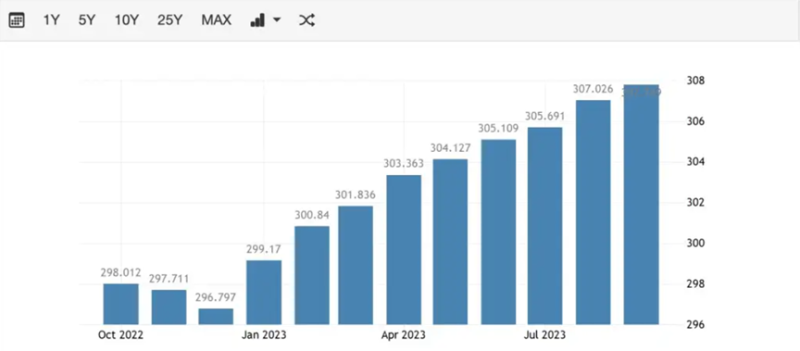
For example, the CPI index data for October 2022 is 298.012, and the recently released CPI index data for September 2023 is 307.789.
In the practical application process of CPI, the core CPI can more accurately reflect the macroeconomic operation situation. Core CPI refers to the CPI after excluding food and energy prices, as food and energy are more affected by climate and seasonal factors.
So, when analyzing CPI data, we need to combine CPI and core CPI together.
In fact, compared to the Consumer Price Index (CPI) itself, the most commonly used is the rate of change in the CPI index, such as the annual and monthly CPI rates.
(1) CPI annual rate: change rate compared to last year
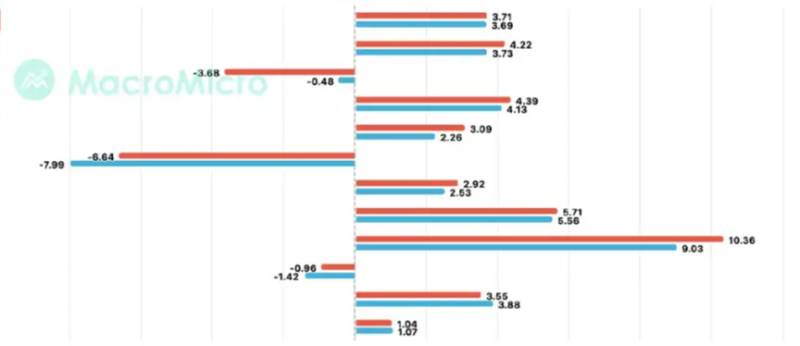
For example, compared to the CPI data in September last year, the annual growth rate of CPI in September 2023 was 3.69%, which is actually the year-on-year growth rate of CPI in September, and there is little change from the year-on-year growth rate in August.
We can not only view the overall year-on-year growth rate of CPI, but also the annual growth rate of CPI items (energy, food, etc.), such as the annual growth rate of clothing and apparel in September, which was 2.26%.
(2) CPI Monthly Rate: The rate of change compared to the previous month
Compared to August, the CPI growth rate in September was 0.40%, which is actually the so-called month on month growth rate. The month on month growth rate in August was 0.63%, while the core CPI growth rate in September was 0.32%.
In the CPI sub item, the month on month increase in housing costs was significant in September, reaching 0.52%, compared to 0.25% in August.
III The relationship between CPI and inflation rate
What is the relationship between CPI and inflation rate?
The inflation rate can be measured by many indicators, and CPI is only one method of measuring the inflation rate, which is also the most common method, The calculation results of CPI can be used to analyze the inflation rate.
The formula for calculating inflation rate using CPI data is as follows:
Inflation rate=(Current CPI - Previous CPI)/Previous CPI x 100
From the meaning of the above formula, it can be inferred that the inflation rate is actually the annual growth rate of CPI.
For example, the annual growth rate of CPI in September is 3.69%, which means that the inflation rate in September is 3.69 (rounded to 3.7), and the percentage inflation rate is 3.7%.
CPI is often an important reference indicator for market economic activities and government monetary policy. Generally defined as inflation exceeding 3% and severe inflation exceeding 5%.
When the inflation rate is too high, the Federal Reserve will raise interest rates to reduce inflation, which is to put the brakes on the economy. On the contrary, if the inflation rate is too low or even enters deflation, the Federal Reserve will lower interest rates to stimulate the economy, which is to put the accelerator on the economy.
For example, after the COVID-19 in 2020, in order to stimulate the development of the U.S. economy, the Federal Reserve adopted a monetary policy of cutting interest rates and releasing water (printing money).
By March 2022, the inflation rate had reached 8.5%. In order to reduce the inflation rate, the Federal Reserve has initiated a rate hike cycle.
From March 2022 to September this year, the Federal Reserve has continuously raised interest rates 11 times, mainly to lower inflation rates.
The current inflation rate of the Federal Reserve is 2%, while the current inflation rate is 3.7%, so there is still a certain gap from the target inflation rate, and compared to the previous two months, the inflation rate data has turned back.
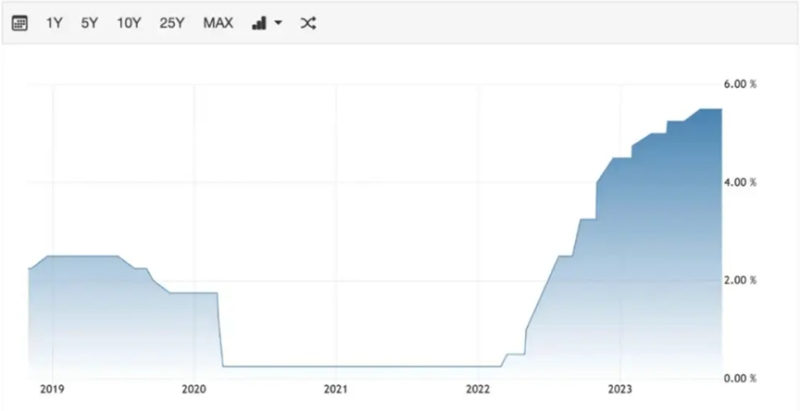
Moreover, according to the recently released non farm payroll data report, the employment situation in the United States is good and economic development remains strong, which undoubtedly increases the time for the Federal Reserve to continue maintaining high interest rates and does not rule out further interest rate hikes to reduce inflation.
4 The Impact of CPI Index on Risk Assets
As is well known, controlling inflation is the main monetary policy objective of the Federal Reserve, and the CPI index is the main indicator used by the Federal Reserve to measure inflation.
The Federal Reserve uses the CPI index as one of the main reference data when adjusting monetary policy.
When CPI is too high, the Federal Reserve will raise interest rates. On the contrary, when CPI growth is too low or even negative, the Federal Reserve will cut interest rates to stimulate the economy. Raising or lowering interest rates will affect the price fluctuations of risky assets.
When the Federal Reserve raises interest rates, as interest rates rise, US dollar assets will strengthen, leading to more risky assets being sold and turning to buying US dollar related assets. This is equivalent to extracting liquidity from the market, and the prices of risky assets such as gold, Bitcoin, and other cryptocurrencies will fall.
On the contrary, when the Federal Reserve cuts interest rates, the motivation for investors to deposit US dollars in banks and charge interest decreases due to the decrease in interest rates. More US dollars will search for higher yielding assets in the market, such as buying cryptocurrencies such as Bitcoin. The interest rate cut is equivalent to adding liquidity to the market, and some funds will flow into the cryptocurrency market, pushing up the prices of cryptocurrencies such as Bitcoin.
So, The impact of CPI data on risk asset markets such as cryptocurrencies is mainly due to its impact on the monetary policy of the Federal Reserve to raise or lower interest rates, thereby affecting the liquidity of risk markets (such as cryptocurrency markets).
Of course, when analyzing the impact of CPI data on the risk asset market, we also need to consider the impact of differences between published CPI data and market expected data.
Generally speaking, when the actual CPI data released by the US Department of Labor meets market expectations, the impact of CPI release on the market is not significant because the market has already digested it in advance.
For example, the CPI data released on the evening of October 12th at 20:30 is basically not much different from market expectations, After the release of CPI data, the volatility of the cryptocurrency market was not significant.

On the contrary, when the actual CPI data released differs significantly from market expectations, the impact on the market will be relatively greater.
For example, when the actual CPI data is much higher than market expectations, it will trigger market concerns about the Federal Reserve's aggressive interest rate hikes, leading to a decline in risky asset prices. On the contrary, when the CPI data is much lower than market expectations, it is relatively favorable for the risky market.
V The Impact of CPI Data on the Cryptography Market
Now that we understand the logical relationship between CPI data and risk assets (including cryptocurrencies), then, Once the CPI index data is released, do we have no idea whether to buy or sell? Obviously, it's not that simple.
Because there are many factors that affect the price of cryptocurrencies, such as the bull bear cycle, halving Bitcoin block production, Federal Reserve interest rate decisions, and even many uncertain factors such as war and geopolitical risks.
Specifically for a certain cryptocurrency, price fluctuations are also influenced by factors such as its own development cycle and the founder's comments.
Taking ETH as an example, the selling of founder Vitalik and Ethereum Foundation, as well as the upgrade of Ethereum Cancun, will all affect the price of ETH. The CPI data released by the US Department of Labor is only one of the many influencing factors. Even, the influence of many factors has exceeded the impact of CPI index on ETH prices.
Moreover, these many influencing factors will also strengthen or offset each other, and the final price increase or decrease is the final result of the interaction between these different influencing factors.
So, when analyzing cryptocurrency price fluctuations, we need to consider these factors, such as non-agricultural data, interest rates A comprehensive analysis of CPI and other factors should be conducted, taking into account the impact of various factors, in order to make wiser decisions.
Disclaimer: The copyright of this article belongs to the original author. Reposting this article is solely for the purpose of information dissemination and does not constitute any investment advice. If there is any infringement, please contact us immediately. We will make corrections or deletions as necessary. Thank you.


